When optimizing a program for performance it’s very common that you spend a lot of time on only a handful of different functions, simply because they are the ones that show up in the profiler the most often. But 99% of your written lines will probably never be looked at during optimization, because they are not relevant for overall framerate. So it can be surprising if a new function shows up during profiling:

To be fair, it does happen from time to time. Since I mostly Superluminal which is a sample based profiler there’s always a chance that even a really short/quick function appears in the profiling data, simply because the profiler happened to take a sample just in this moment. In this case, this apparently wasn’t the case.
For the recorded sessions, Superluminal was running at 8190 Hz, which means that a single random sample should have a maximum length of about 120 μs. This function call, which lasts 202 µs (0.2 ms), indicates that it’s not just a random sample, but that the function has a measurable effect on the editor’s frame rate.
But even this fact for itself wasn’t that alarming so far. A function that takes about 0.1 to 0.2ms may be worth optimizing, but most of the time I skip such small functions in search of more meaningful options. I almost did that in this case, too, when I took a look at the function’s statistics:

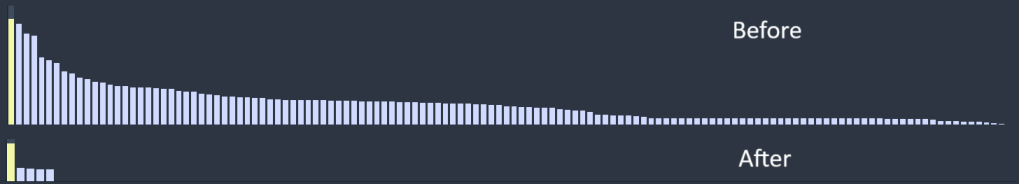
In case you are not familar with Superluminal, this pillar graph shows all recorded durations of a selected functions sorted from long to short. In this case, most calls end up only taking around 0.1ms. But some calls take more than five times as long, over half a millisecond (left side of the graph). I got suspicious, was this high variance a simple outlier? Or was this variance normal? I started to do more profiling runs, and indeed, this high variance persisted. After only a few more minutes of profiling I caught far more alarming results, even exceeding the 2ms mark.
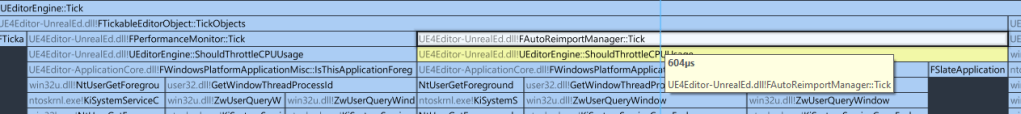
So what is this function doing? As the name suggest it’s checking if the editor should be run at the highest possible framerate or if can be throttled down e.g. due to running in the background or being out of focus. This prevents Unreal from occupying all your machine’s resources while you are working in another application. This is also visible in the profiling data: Around 90% of it’s runtime is spent on a function checking if the editor is running in the foreground.

And looking at the screenshot you can already see the reason why the function can take that long too run: It’s accessing a “critical region”.
Critical what?
A critical region, or as it’s often called, a critical section, is a construct designed to take advantage of multithreading issues. One of the main problems with multithreaded programming is managing multiple threads accessing the same piece of memory. If thread A reads a piece of memory that thread B is currently writing to, thread A may receive partially written or partially updated data, which can cause a lot of unexpected problems, the best case being a crash.
A critical section is basically a simple barrier that allows only one thread at a time to access the specified region, with all other threads having to wait for the other thread to finish it’s access.
In this case, the code may not look that multithreaded, as we are only looking at the gamethread – Unreal’s “main” thread. But even an application running on a single thread is still running in parallel with other programs running on the same machine. Since we are accessing data that is globally available to all other programs – thread ids and windows data – all accesses to this data are protected by a critical section.
This also explains the high variance in execution time. If no other program is accessing the same section, the function returns the required information almost immediately. If several other programs access the section, our Unreal editor may have to wait for all the other applications before it can retrieve the information it needs. This makes profiling this issue and testing potential improvements a very unreliable and bothersome task.
As it turns out this imaginary waiting line can become very very long o.O

0.14 seconds spent on a single function call in real-time application. Time to ring the alarm!
So at this point we know we need to fix this. But how?
We can’t do anything about the critical section directly since this section is part of Windows, to which we sadly don’t have any source code access.
Option 1: Call it less often
The function is not just called to throttle the CPU when necessary. Other systems in Unreal also use the same function to decide whether to work at “full force” or not, like the AutoReimportManager. By calling the function once in EditorEngine::Tick and storing the result in a variable for the rest of the tick, we can at least halve the number of calls and thus the number of spikes. Progress, but obviously not a perfect solution.
Option 2: Make it event based
The next thing I tried was to look through the Windows API documentation to find an alternative or workaround to this potentially slow function. Unfortunately, there doesn’t seem to be an async version of the function that would wait for the critical part in another thread (we’ll get back to this later). But there is something else that looks promising, a function called SetWinEventHook(), which is meant to set a callback function that will be called when something happens to our editor window. This way we could track the foreground state of the editor window ourselves based on the broadcasted event, without ever having to call the critical section. Unfortunately, I didn’t investigate this approach any further, mainly because I could only try to implement it on Windows. I’m sure similar functionality exists on Linux and Mac, but I don’t have any experience with them, nor do I have an Mac lying around. Perhaps Epic Games themselves could implement such a change, but for now I’ll have to look for a more pragmatic solution.
Option 3: Move the slow part to another thread
Fortunately, in this particular scenario, there is a simple workaround we can do: Wait all the way through, but do it on another thread. The main thread shouldn’t be completely blocked while it’s getting the information, so instead we can call the function on another thread and let the main thread just check on the next frame to see if the result is ready.
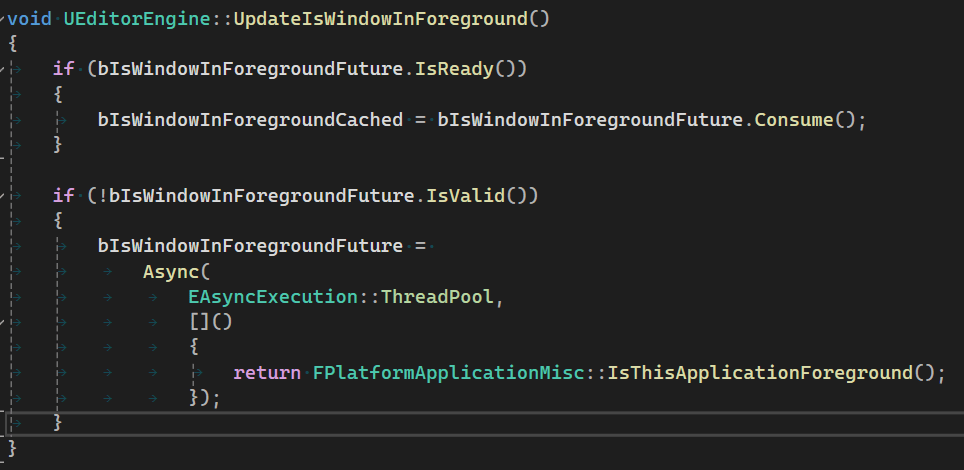
Calling this function every tick, we can replace all calls to IsThisApplicationForeground with the saved result bIsWindowInForegroundCached. Voila, now the function barely shows up on the game thread in profiling (as it should).
So, is everything perfect now? Well, it seems so at first glance – but I wanted to make sure that the new thread wasn’t messing things up elsewhere, and went through the profiling data again. And yes, the new thread can still be blocking if the game thread accesses the same critical section elsewhere. For example, when trying to find the window under the mouse cursor via FWindowsApplication::IsCursorDirectlyOverSlateWindow, or even just accessing the cursor position via FWindowsCursor::GetPosition:

So one could (and should) continue going down this rabbit hole of avoiding the critical section, but this change should already improve things for now.
If you read my rumblings up to this point, you can follow me at Mastodon, Bluesky or LinkedIn or subscribe to this blog directly below this article. I publish new articles about game programming, Unreal and game development in general about every month.
Update (May 2025)
I recently came across a very similar problem in the code that Unreal uses to update the active cursor shape. This is done by calling the Windows function SetCursor, and similar to the case above, this function also accesses a critical section and again leads to some random spikes of similar intensity. This time, however, I was able to mostly fix the problem by only calling this function when the cursor shape has actually changed (instead of every frame). The pull request can be found here.
The big lesson from all this is probably to avoid calling windows functions as much as possible.


Leave a comment