“Optimizing a game” and “developing a game” are two activities that tend to blur together. And while you probably have an elaborate toolbox for developing your game, when it comes to optimizing the performance of a game, those tools may not be enough. In optimizing various aspects of games, I have tried many tools over the years. And while there is never a definitive answer as to which tools best fit your process, there are certain categories of tools that you should have at your disposal.

1 – A sampling based profiler
The most important tool I always recommend when people start looking at optimizing their game is to learn how to use a general sampling-based profiler. Most game engines and frameworks out there offer a lot of metrics and performance tools out of the box. But at the end of the day, all these tools can only measure the metrics they were told to measure because someone, at some point, expected them to be relevant. This is a huge drawback, because in most cases of bad performance, the reason is that some code is behaving in an unexpected way, or else the code would not have been written that way in the first place. A sampling-based profiler measures what is actually happening, essentially giving you a ground truth of where all the time is spent.
An often-recommended – and free – tool for this is Intel’s Intel’s VTune Profiler. While this sounds like the easiest way to get started, I’d always recommend Superluminal over it – mainly because of its much cleaner interface. Although it’s not free, it’s well worth the money and even offers perpetual and academic licenses.

Admittedly, VTune offers some more advanced features when it comes to low-level profiling, such as cache miss statistics. Just be aware that most of these only work if you are using an Intel CPU.
2 – A frame debugger
Do you know how your engine actually renders a frame? Chances are that your answer is something like “sort of”. But when rendering a scene takes longer than expected, that answer isn’t really helpful. To get under the hood of your renderer and find out where all those drawcalls are coming from, a frame debugger can be a godsend.
Not only are frame debuggers a useful tool for finding bottlenecks in your own game, they are also a great research tool for finding out how other games out there achieve their visuals. It allows the creation of detailed rendering analyses such as this one.
The most know solution for this is probably Renderdoc, a former internal Crytek tool that now is available and developed under an open source license. It can grab a frame of a running game and show exactly what commands and resources were used and in what order to render it. It can sometimes be a bit finicky to get working, but at least Unreal and Unity even offer integrated support.
There are of course alternatives. Microsoft for example offers PIX (not to be confused with Microsoft Pix, an mobile camera app), which as the name implies only works with DirectX games. NVidia alternative is called Nsight Graphics and offers even more profiling data.
3 – Compiler explorer
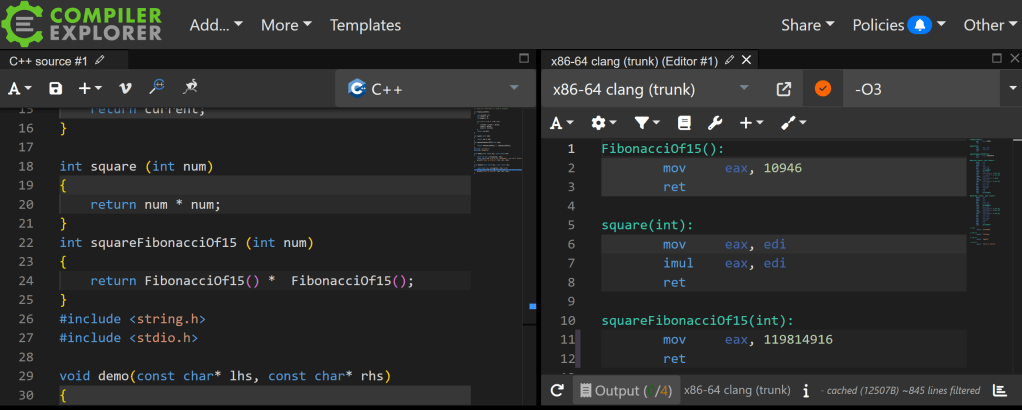
Ok, this category is also the name of the actual tool, mainly because I don’t even know any competitor for Compiler Explorer. This site compiles allows you to compile code in the browser and view the generated compiler output. Personally I only use it for C++ code to browse the generated assembly code, but there are a bunch of other supported languages like Rust, C#, Python etc.
Main use for me is to check what stuff a selected compiler actually optimizes and what it does not. There’s a lot of half-knowledge and myths when it comes to compiler optimizations, and it’s a good idea to check that the optimization you expect is actually being used.
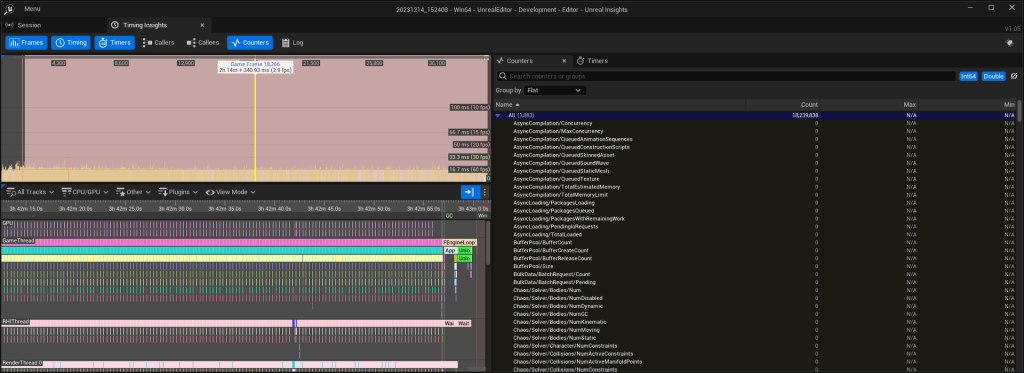
4 – Your in-engine/framework profilers
Wait, didn’t I just recommend to use general-purpose profiler a few lines ago? Yes, and in general I always recommend them over the internal profilers of any engine/framework. But why use only one profiler when you could use several? Many integrated profilers offer additional data that a general CPU profiler can’t capture, like used resources and assets, counters, and more. Unreal Insights for instance not only measures CPU usage but also displays memory usage, network usage or frametime spikes.
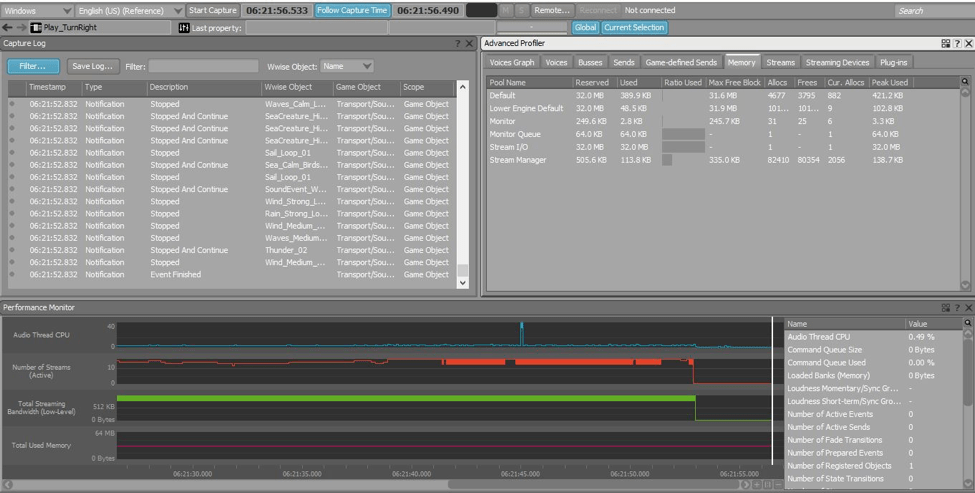
But your engine’s profilers are probably not the only specialized profilers available to you. Depending on the middleware you use, there are many more options. For audio performance both WWise and FMOD offer custom profilers, that offer audio-specific data about used voices, channels and events, that other, general profilers can’t offer in this way.
5 – Memory layout visualizer
Many CPU bottlenecks are actually memory bottlenecks, where the CPU is just waiting for needed data to be moved into it’s registers. If you suspect that this is the bottleneck in your code (and only then), you should look at the memory layout of your class, move data that is often used together closer together, or fill unwanted gaps in memory alignment. You should have a tool to check that these changes actually do what you want them to do. Personally, I just use Visual Studio’s internal memory layout visualization, but there are other tools available.
And that’s my short list of tools I’d recommend adding to your toolbox if you care about your game’s performance. Of course, lists like this are not exhaustive. If you have other tools in mind that you think should be listed here, just drop me a line at Mastodon or Bluesky. Follow me there or subscribe to this page for more articles on programming, optimization, and Unreal shenanigans.


Leave a comment