
One of the quirks that Unreal beginners are often irritated by is the fact that the Unreal editor has not only one, but two log windows. The more commonly used one is called ‘Output Log’ and is what you’d expect from a log: A simple text display that usually looks something like this:
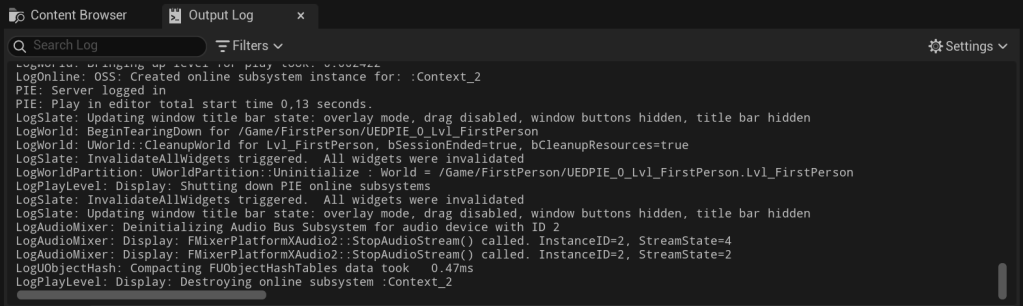
Technically, it’s a simple display of text (with some filter and search functionality), which is a good thing since the amount of log messages in Unreal can, depending on the project, reach massive sizes. Thanks to the rather simple text-form, this doesn’t cause performance issues, even with multiple thousands log messages per second.
But wait, wasn’t there a second log? You are right, let’s take a look at Unreal’s second log, called the ‘Message Log’:
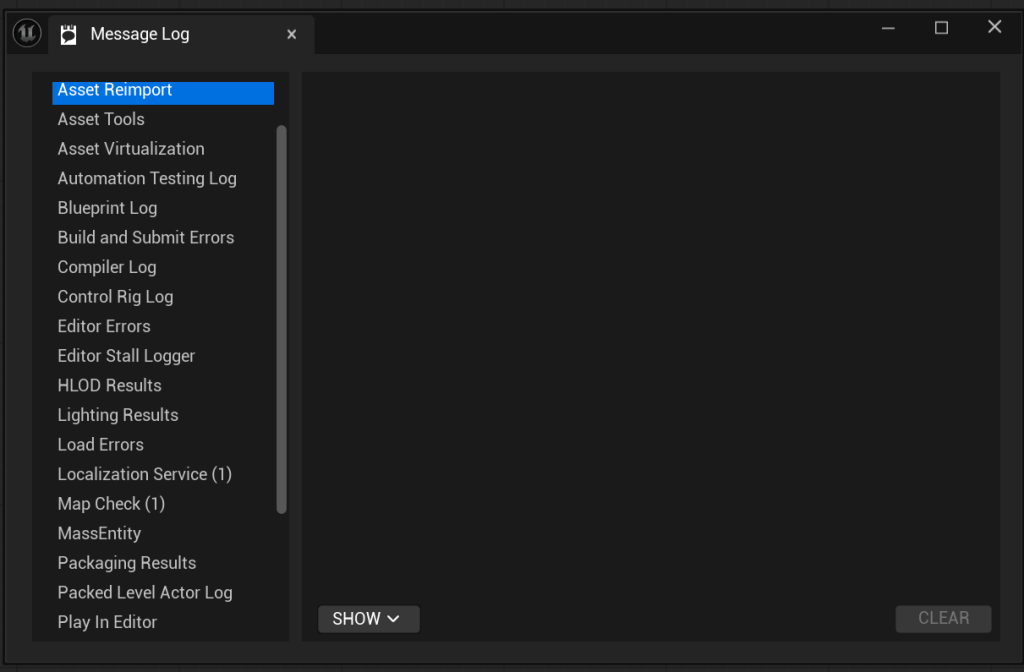
This one is the fancy version, offering extra features like links to assets, or even to specific nodes inside of blueprints. If, for example, a blueprint of yours tries to access a non-existing object, the log will show an error message with a link to the specific node that tried to access it:

What’s the drawback of those features? The message log is MUCH less performant than the output log. While you can send thousands of messages to the output log per frame while maintaining a playable frame rate, this is NOT possible with the message log. For testing, I created a small blueprint throwing 100 blueprint runtime errors per frame:
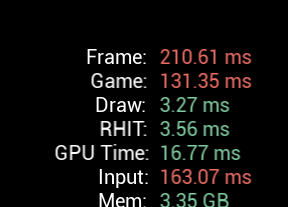
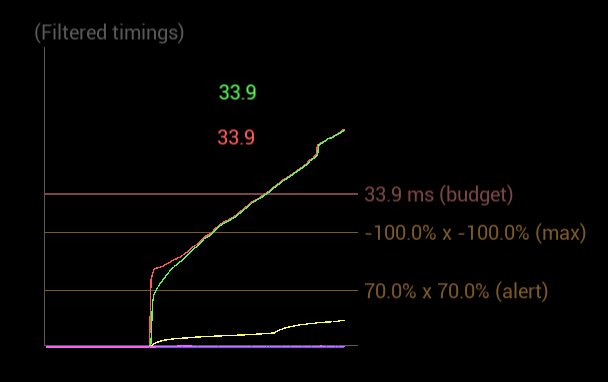
Not exactly a great performance. While a slowdown is to be expected, a difference of an order of magnitude is not. Even stranger: The frametime impact isn’t that severe right from the start, the first 1-2 seconds are perfectly playable. But the frametime builds up over time and it does so at a rapid rate. The more log messages are created, the slower the editor becomes:
Profiling The Crime Scene
Something is deeply wrong here, so let’s grab our favourite profiler, and see what’s going on!
Finding the slow block in the profiling data is quite easy, since it’s basically the only thing you can see when zooming in:
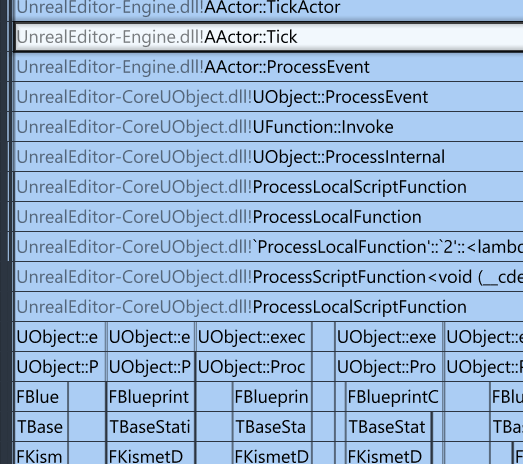
AActor::Tick being that slow makes perfect sense, since the error is triggered inside of it, with the ProcessLocalScriptFunction being the interal C++-function that executes the blueprint tick. Now I just need to go further down the callstack until I find something unexpected:
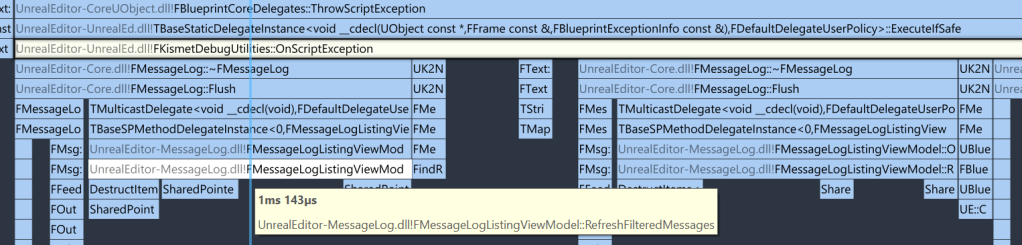
At ‘FMessageLogListingViewModel::RefreshFilteredMessages’ my alarm bells start to ring. The code should just add a single message, but apparently multiple messages – note the plural – are “refreshed”? This doesn’t sound good, so let’s check the code:
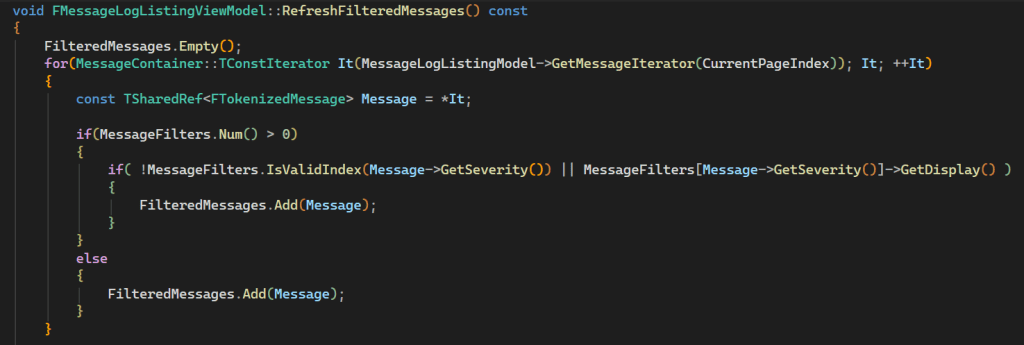
Indeed, the function does what the name implies: It tosses all(!) messages that are currently shown in the Message Log (even de-allocating the memory while doing so), and then re-adds them all one-by-one, depending on the filter. To be fair, if somebody would ask me to write a refresh function I would probably write the same (except for the empty()-call in the first line – we’ll get to that).
The actual problem is that the whole list is rebuilt every time a new message is added, meaning the cost of every newly created message is increased by the number of messages created so far.
At the start, this isn’t a problem, the first message is created, and the list is refreshed. Since only one message exists, only one message needs to be added to the list at this point. Then, the second message gets added, and the list rebuild already needs to add two messages, making 3 overall so far. The third one adds another 3 messages (six overall), etc.
Because of that, even though we only log 100 messages, 5050 messages are added to the list in our first frame alone. Since the message list is persistent between frames, this continues to add up: During the second frame, it will be 10050, then 25050, 35050, 45050, etc.
During frame 200, the refresh will need to add around two million messages! This actually matches the linear increase in the frame time perfectly:
So we figured out why this is slow, how can we speed things up? There are angles from which we can tackle this.
Starting with the small stuff
The first optimization that I did was to change the already mentioned emptying of the messages list. In the original version, the elements are not only removed from the list, but the array is also resized to 0 afterwards to free up memory. This sounds nice at first, since we could use this memory for other stuff elsewhere, but since we re-add all the messages right afterwards there is no need to waste time on slowly de-allocating memory. So let’s change the call to not affect memory allocation:

In my very short test this saved already multiple milliseconds, but I admittedly didn’t profile that change in great detail, we have a bigger fish to fry.
Skip unnecessary refreshes
One of the frustrating parts about the current behavior is how often the same list is refreshed just to be overwritten by the next refresh, without ever being used. In our example, the refresh is executed 100 times per frame, just to be drawn in the UI once. If we could skip the first 99 refreshes and just execute the last one, we could save 99% of the spent time.
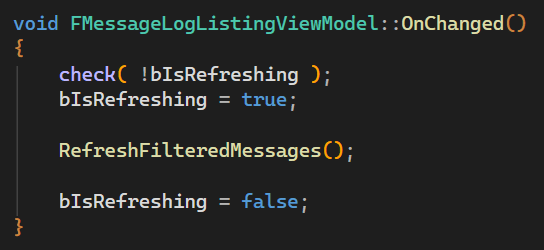
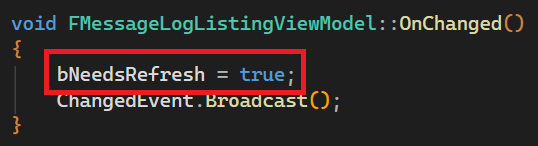
This is actually easy to implement: Instead of refreshing the list anytime a message is added, we just set a newly introduced flag that saves the information if a refresh is needed before the list can be used again:
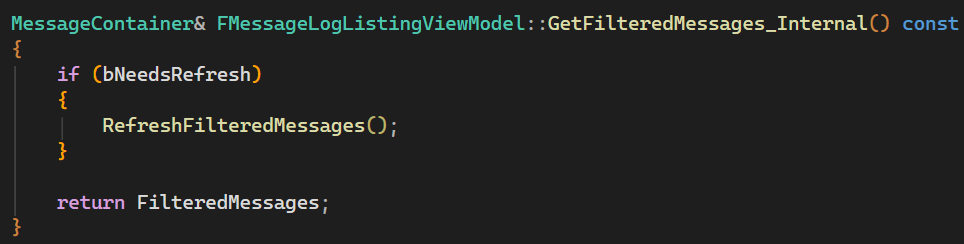
Only when the list is actually accessed (for example to be drawn as part of the UI) a refresh is executed:
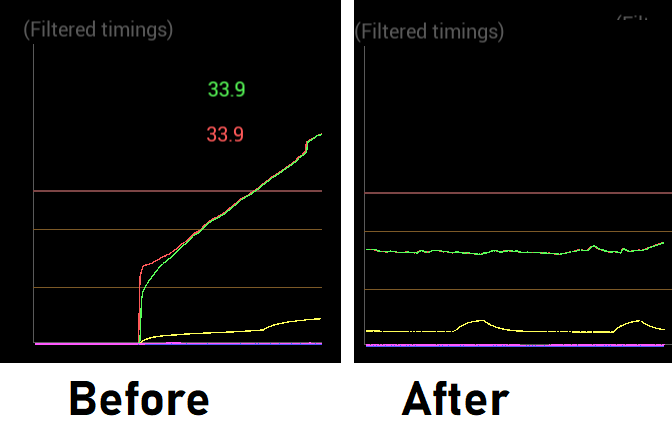
Even without attaching a profiler, the change is noticeable instantly; the difference in the frame time graph is a day-and-night experience. On the left, you can see the first seconds of playtime with the old implementation, on the right, the new implementation after multiple minutes of runtime!
But wait!
You might have noticed that this change didn’t fix the core issue of the increasing time needed for the list refresh, it just treats the symptom by doing the refresh less often, but in my test cases this was more than enough. I briefly thought about improving things further in case somebody has to handle a higher rate of log messages and set up a test case with 1000 messages per tick. At this point I ran into other bottlenecks first, namely the logging to the Windows output log to which every log message is mirrored.
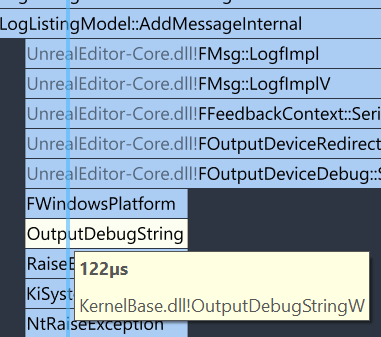
Hitting an OS function as a performance bottleneck however is a good indicator that we are indeed scraping the bottom of the barrel here, so I’m happy with my fixes so far. You can find the described changes in this pull request. (if you hit a 404 error, make sure that you are logged into your GitHub account and that your Epic games account is connected to it. More details here).
If performance horror stories are of interest to you, consider following me on Mastodon, Bluesky or LinkedIn for more articles about Unreal, game optimization and other gamedev topics.
You can also subscribe to this blog directly below this article to stay informed about future posts 🙂





 Larst Of Us
Leave a comment