
After writing one article on how to speed up Unreal’s editor launch by not spawning 38000 tooltips and one on how to speed it up further by not opening 5500 files and getting the described fixes merged in for 5.8, I sort of stopped looking into the topic for a while. Surely, the low-hanging fruits were all found by now, right? Finding another substantial optimization wouldn’t be easy.
Well, time passed, and my curiosity took the better of me. “Just one short profiling session.” I told myself, while starting up the profiler once again. And after only a minute of looking through the Superluminal trace, I found something that looked like I found gold:

Spending up to 8 seconds in one function call? This seems worth investigating, especially since it already sounds like it’s doing a lot of unneeded work. Loading “all culture data”? I’d prefer “loading the minimum amount of culture data needed to get to the editor”, thank you very much.
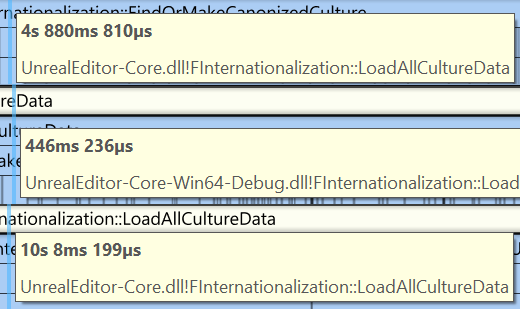
To be fair, after multiple rounds of profiling, it was clear that the function wouldn’t always take 8 seconds and would finish a lot faster in many cases. Normally, during profiling, I do 3-4 runs to reduce the impact of random outliers, but in this specific case, the values just continued to vary, even after a dozen different runs. From as low as 0.4 seconds, up to a baffling 10 seconds:

Thankfully, Superluminal not only shows the call stacks but also how busy the threads were at certain points. Looking at the graph, the variance started to make more sense. 99% of the time the thread was blocked by short IO operations like those:
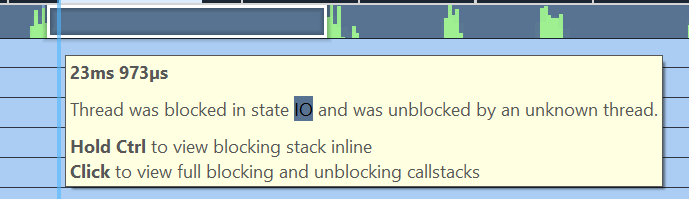
Or, to put it simply: The main thread reads hundreds of tiny files, one after another. We will get to what those files are and what we need them for in a minute, but this bit of information already explains why the measured times vary as much as they do. All those file reads are done synchronously during the editor start, a time at which a bunch of other threads is already loading other stuff, from the same drive. Based on timing and the activity of the other threads, we run into dozens or hundreds of of I/O bottlenecks and the thread spends most time just waiting for a chance to load the next file. Not an ideal situation, surely we can speed things up?
Finding out what files are even loaded
For a start, let’s see if we can figure out what the function does, and why it is even called.
The content of the function is actually quite straightforward:

It loops over a list of known ‘cultures’ and loads them. “What’s a culture?” you ask? This question is easy to answer by looking into the class definition: It’s basically a list of strings holding all the different names of a language (English name, native name, display name) and some meta data (Iso-code, verse-Identifier):
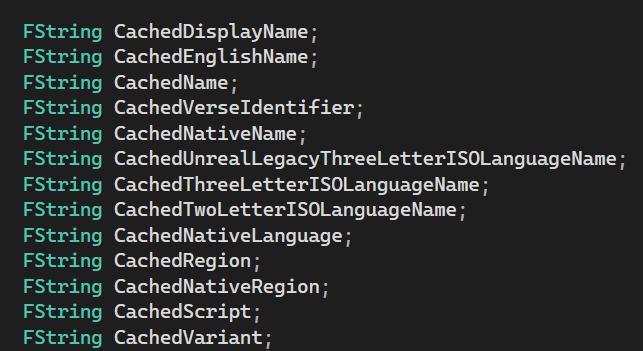
Not very exciting stuff so far. Why does it take so long to retrieve a few strings? Well, the first issue is that Unreal knows a lot of different languages/cultures. 837, to be exact. Multiplied with the 13 strings that are the content of every culture, that is already some work. But copying 10000+ strings in itself still wouldn’t be a big problem. The real issue is that all of those strings are not baked into the code, or put into one single file that is read once and cached for later use. Instead, all of those different information points are scattered over multiple files. It’s not even one file per culture, in most cases, the data for a single culture is already distributed over multiple files. Just to retrieve all the needed names for the culture “German,” Unreal needs to open and load four(!) different files! This results in 1585 files being opened and closed (yes I added a counter for this), along with all the overhead that comes with it.
I’m pretty sure that refactoring this code to use only one file would result in a significant performance boost. But the type of refactoring that touches >1500 files is not one commonly accepted as a pull request. Isn’t there something simpler we could try first?
To load or not to load
Why would the editor even need to load all languages on every single start? Isn’t one language enough? Let’s see if the call to the function gives us any hints.

Okay, this makes some sense. According to the comment, all languages are loaded to avoid hitches later at runtime. This is a common optimization, especially in games. You are trading very annoying hitches during gameplay for a bit of initial loading time at the start of the application. For this optimization to make sense, however, you should make sure that hitch itself occurs in scenarios where it is more annoying than the longer launch time. In games, this is almost always the case; in application software, like the Unreal Editor, not so much (except during Play-In-Editor). Where could the hitch appear that it’s worth sacrificing so much time during start-up for?
To figure that out, I just commented out the function call completely and started the editor. If the comment was correct, I now should see a hitch somewhere while using the editor.

Hitches
Overall I found three actions that would trigger the loading of culture data and therefore a new hitch:
– Opening the Localization Dashboard
– Opening the Editor Preferences
– Opening Project Settings
Note that triggering any of those hitches makes triggering the other two ones impossible, since the loaded data is kept around, just as it was done before at editor start.
Why should the panels need to load these culture data? Well because all of them contain some form of language selection, mostly implemented as dropdown menus like this one for the editor language selection:
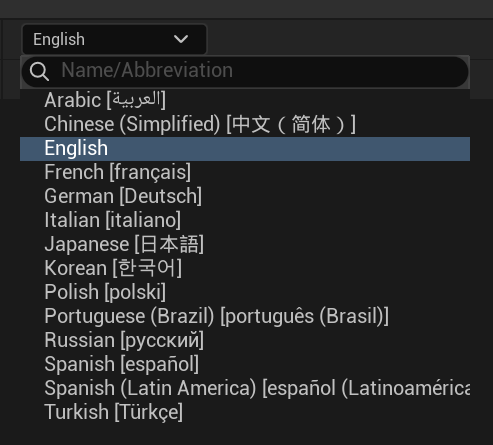
Yes, you read that right, the 1585 files are just loaded to fill some dropdown menus. Even more baffling is the fact that those dropdown menus always build a list of ALL (!) 837 languages, no matter how many languages they actually need to show. In the above example for the editor language selection only 14 languages need to be shown, but internally the dropdown menu will build a list of 837 languages, load a second list of the 14 available languages and then filter out the 823 unavailable ones…
In theory, this would be a great starting point for another optimization in the future, but for now, I didn’t do that since, after all, the moved hitch was already much smaller than before my change.
Fast enough
Wait, smaller hitch? Why would the hitch be smaller just because we moved it? Well, since the culture data isn’t loaded during the editor startup phase anymore, the culture data loading doesn’t have to wait anymore for other threads reading files. It mostly clocks in at 0.2 – 0.3 seconds now, compared to the previously measured values between 0.3 and 10 seconds. That’s around 10-20 times faster!

For me that’s good enough. Not only is the culture loading faster, we also moved it from a code path that is used in every single editor session to one that is only used in a small fraction of editor sessions. It’s like moving a pothole from a busy highway to an abandoned field track – the pothole is still a pothole, but it annoys fewer people.
The fix and an outlook
You can find my change as a pull request here. (If you can’t access the link, make sure that your Unreal account is linked to your GitHub account and you are logged in. You can find more information in the official documentation).
I’m still certain that the remaining hitch of 0.2-0.3 seconds is also very avoidable, and already have a half-finished fix laying around, but at this point, I’m not sure if the effort is worth the rather small speed up. So, no promises for now. 😉
If you are interested in getting notified about any potential follow-up optimizations, or if you like articles like the one you just read in general, consider subscribing to my blog below or follow me on BlueSky, Mastodon, or LinkedIn.




Leave a comment